
In our digital-first world, we’re bombarded with information—but we don’t always absorb it. Infographics transform data, instructions, or complex topics into visual stories. For someone like me—writing about wellness, balance, and nightlife—infographics are one of the most effective tools to engage readers and make insights stick.
In this post, I’m breaking down two infographics that perfectly align with my blog’s theme. Both tell powerful stories with visuals, and each offers creative techniques I plan to use in my own infographic design.
8 Mental Health Benefits of Exercise – Mindfulness Meditation Institute
Mindfulness Meditation Institute
Why It Works:
- Visual Hierarchy: The infographic uses numbered sections to present each benefit, guiding the reader through the content in a logical sequence.
- Color Choices: A vibrant mix of colors distinguishes each section, maintaining visual interest and aiding in information retention.
- Typography: Bold headings paired with smaller descriptive text create a clear distinction between topics and details, enhancing readability.
- Balance of Text and Visuals: Each benefit is accompanied by an icon, providing a visual representation that complements the text and reinforces the message.
- Storytelling with Data: By enumerating specific benefits—such as improved mood, reduced anxiety, and enhanced cognitive function—the infographic effectively narrates the positive impact of exercise on mental health.
This infographic demonstrates how to break down complex information into digestible parts. For your own project, consider using a similar approach to present steps or tips for maintaining mental clarity after social events, ensuring each point is distinct and visually engaging.
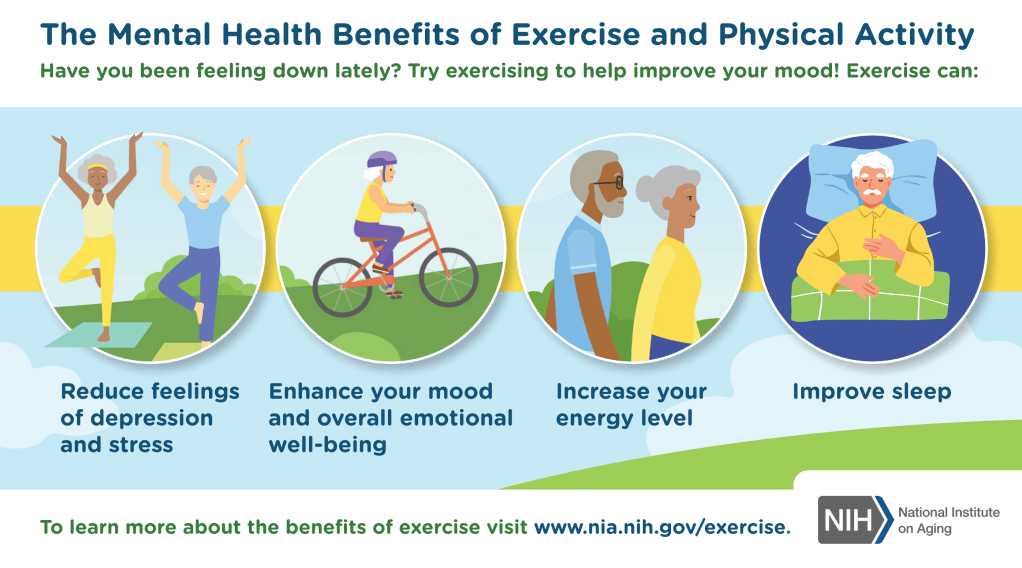
“Mental Health Benefits of Exercise and Physical Activity” – National Institute on Aging
Source: National Institute on Aging
Why It Works:
- Visual Hierarchy: The infographic presents information in a clear, organized manner, using bullet points and headings to guide the reader through the benefits of exercise on mental health.
- Color Choices: A soothing palette of blues and greens creates a calming effect, aligning with the theme of mental well-being.
- Typography: Clean, legible fonts ensure readability, making the information accessible to a broad audience.
- Balance of Text and Visuals: The combination of concise text and illustrative icons effectively conveys the message without overwhelming the viewer.
- Storytelling with Data: By highlighting specific mental health benefits—such as reduced feelings of depression and stress, enhanced mood, increased energy levels, and improved sleep—the infographic tells a compelling story of how physical activity positively impacts mental well-being.
This infographic serves as a strong example of how to communicate complex information succinctly and engagingly. For your own project, consider using a similar structure to outline the mental health benefits of post-party recovery routines, ensuring clarity and visual appeal.
By Mia Gish and her AI superheroes

Leave a comment